To accompany the launch of the new Market Dynamics feature in the Abatable Platform, our Data Science Lead Rey Esmaielbeiki dives into Abatable’s datasets to make sense of what the numbers are saying about the voluntary carbon market today.
Survey today’s sustainability and climate headlines, and you’re often confronted with news about companies walking back net-zero commitments, continued scrutiny of corporate approaches to climate change, and debates over the use of carbon markets in sustainability strategies.
But what does the data actually say about how companies are using carbon credits?
We interrogated Abatable’s carbon credit issuance and retirement dataset to explore this question. To recap: carbon credit issuances give a direct view of the volume of credits coming to the market, whereas retirements are a proxy for demand, and can reveal who is retiring credits, for what purpose, from which type of projects, and when. You can interact with this data in our platform.
Our key findings:
- Over the last decade, buyers have retired over 1.1bn tonnes of carbon credits. We see continuous retirement growth for nearly six years, reaching a peak by the end of 2021, and a follow on peak in 2024.
- Buyers are preferring newer credits and leaving older vintages behind. The average time between credit issuance and retirement is around six years and has become shorter since the Paris Agreement came into force.
- Issuances have consistently exceeded retirements over the last decade. Even though the overhang has diminished over the last two years, the market has never fully absorbed all the excess supply, leading to a persistent surplus that weighs on prices.
- The buyer base has gradually broadened over the last five quarters, with large legacy buyers scaling back slightly and a wider set of smaller participants entering the market. The market is moving into a highly diverse buyer base.
- Nearly half of all carbon credit retirements are still attributed to unknown beneficiaries, but the share is declining as registry disclosure practices tighten alongside frameworks such as CORSIA (the Carbon Offsetting and Reduction Scheme for International Aviation) and the Integrity Council for the Voluntary Carbon Market. Buyers are increasingly choosing to disclose retirements publicly – a signal that market transparency is improving and that trust in the voluntary carbon market (VCM) is gradually being rebuilt.
Takeaway one: Retirement volumes have been consistent since 2021
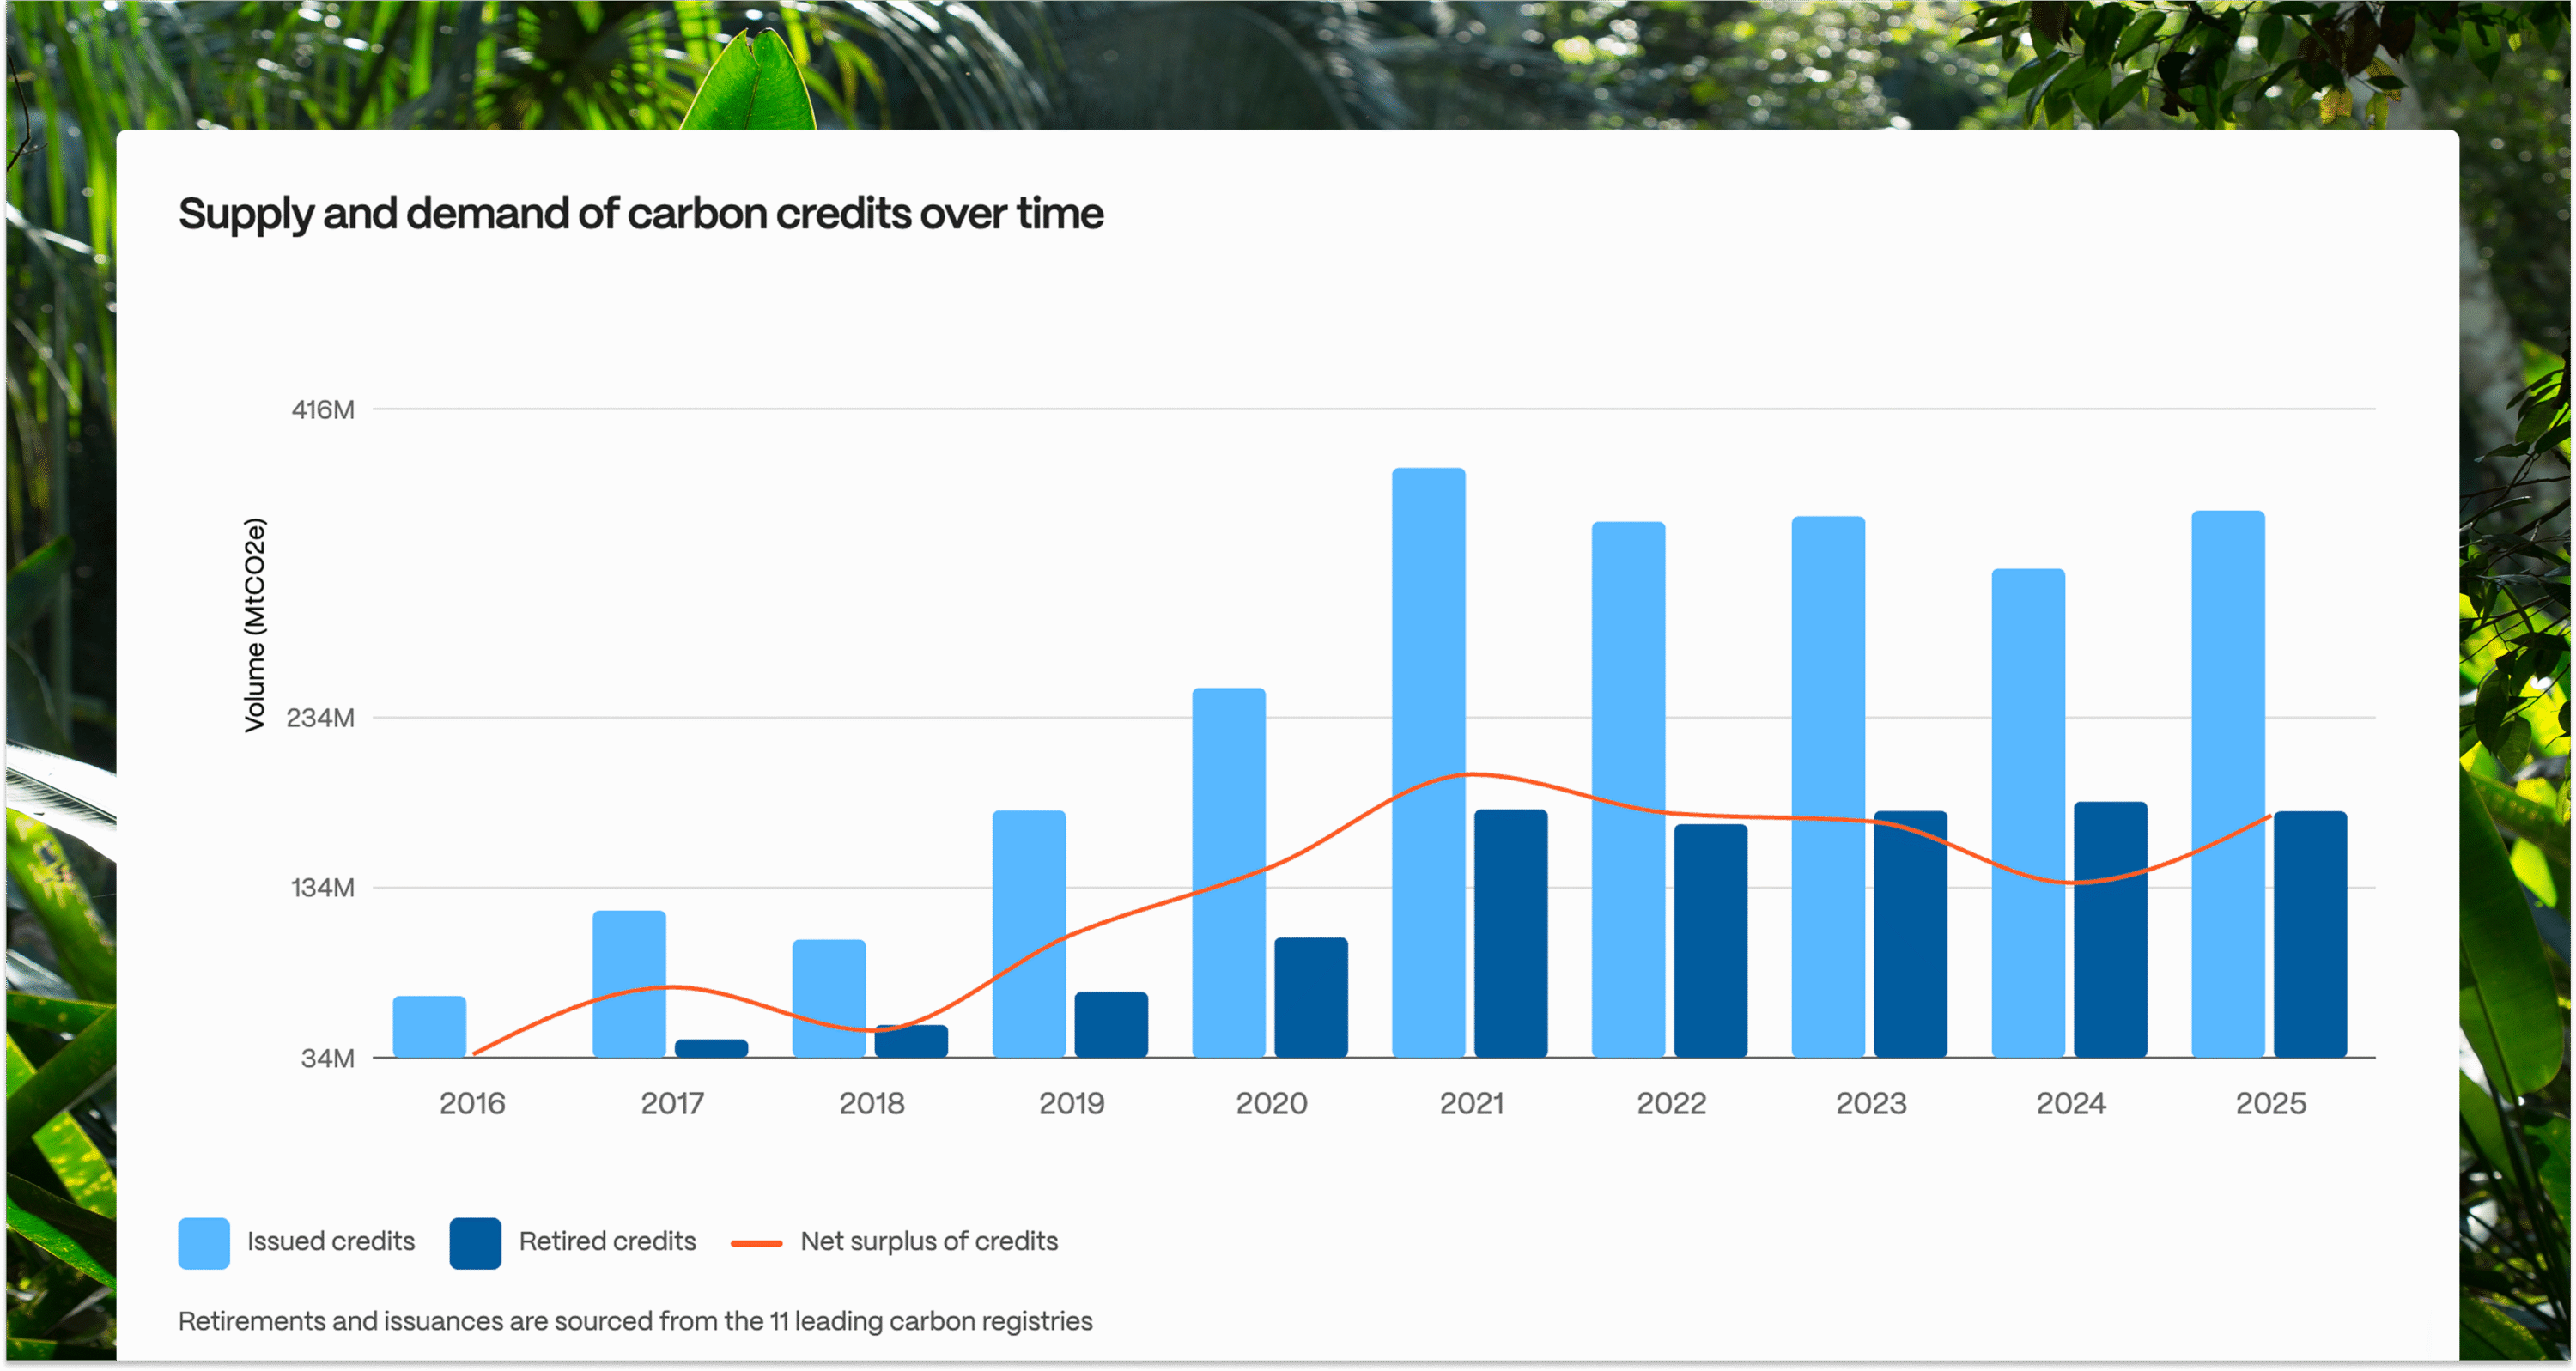
Figure 1: Total annual retirements and issuances per year. Source: Abatable
Companies have retired over 1.1bn carbon credits over the last decade, with annual volumes peaking around 2021 and 2024 and slightly softening after each peak. Year on year, retirement volumes have remained broadly flat, varying by only 2–3% since 2021. However, the within-year retirements bring a more nuanced view of demand cycles and seasonality, as shown below.
Takeaway two: Yearly retirements hide a shift in demand seasonality
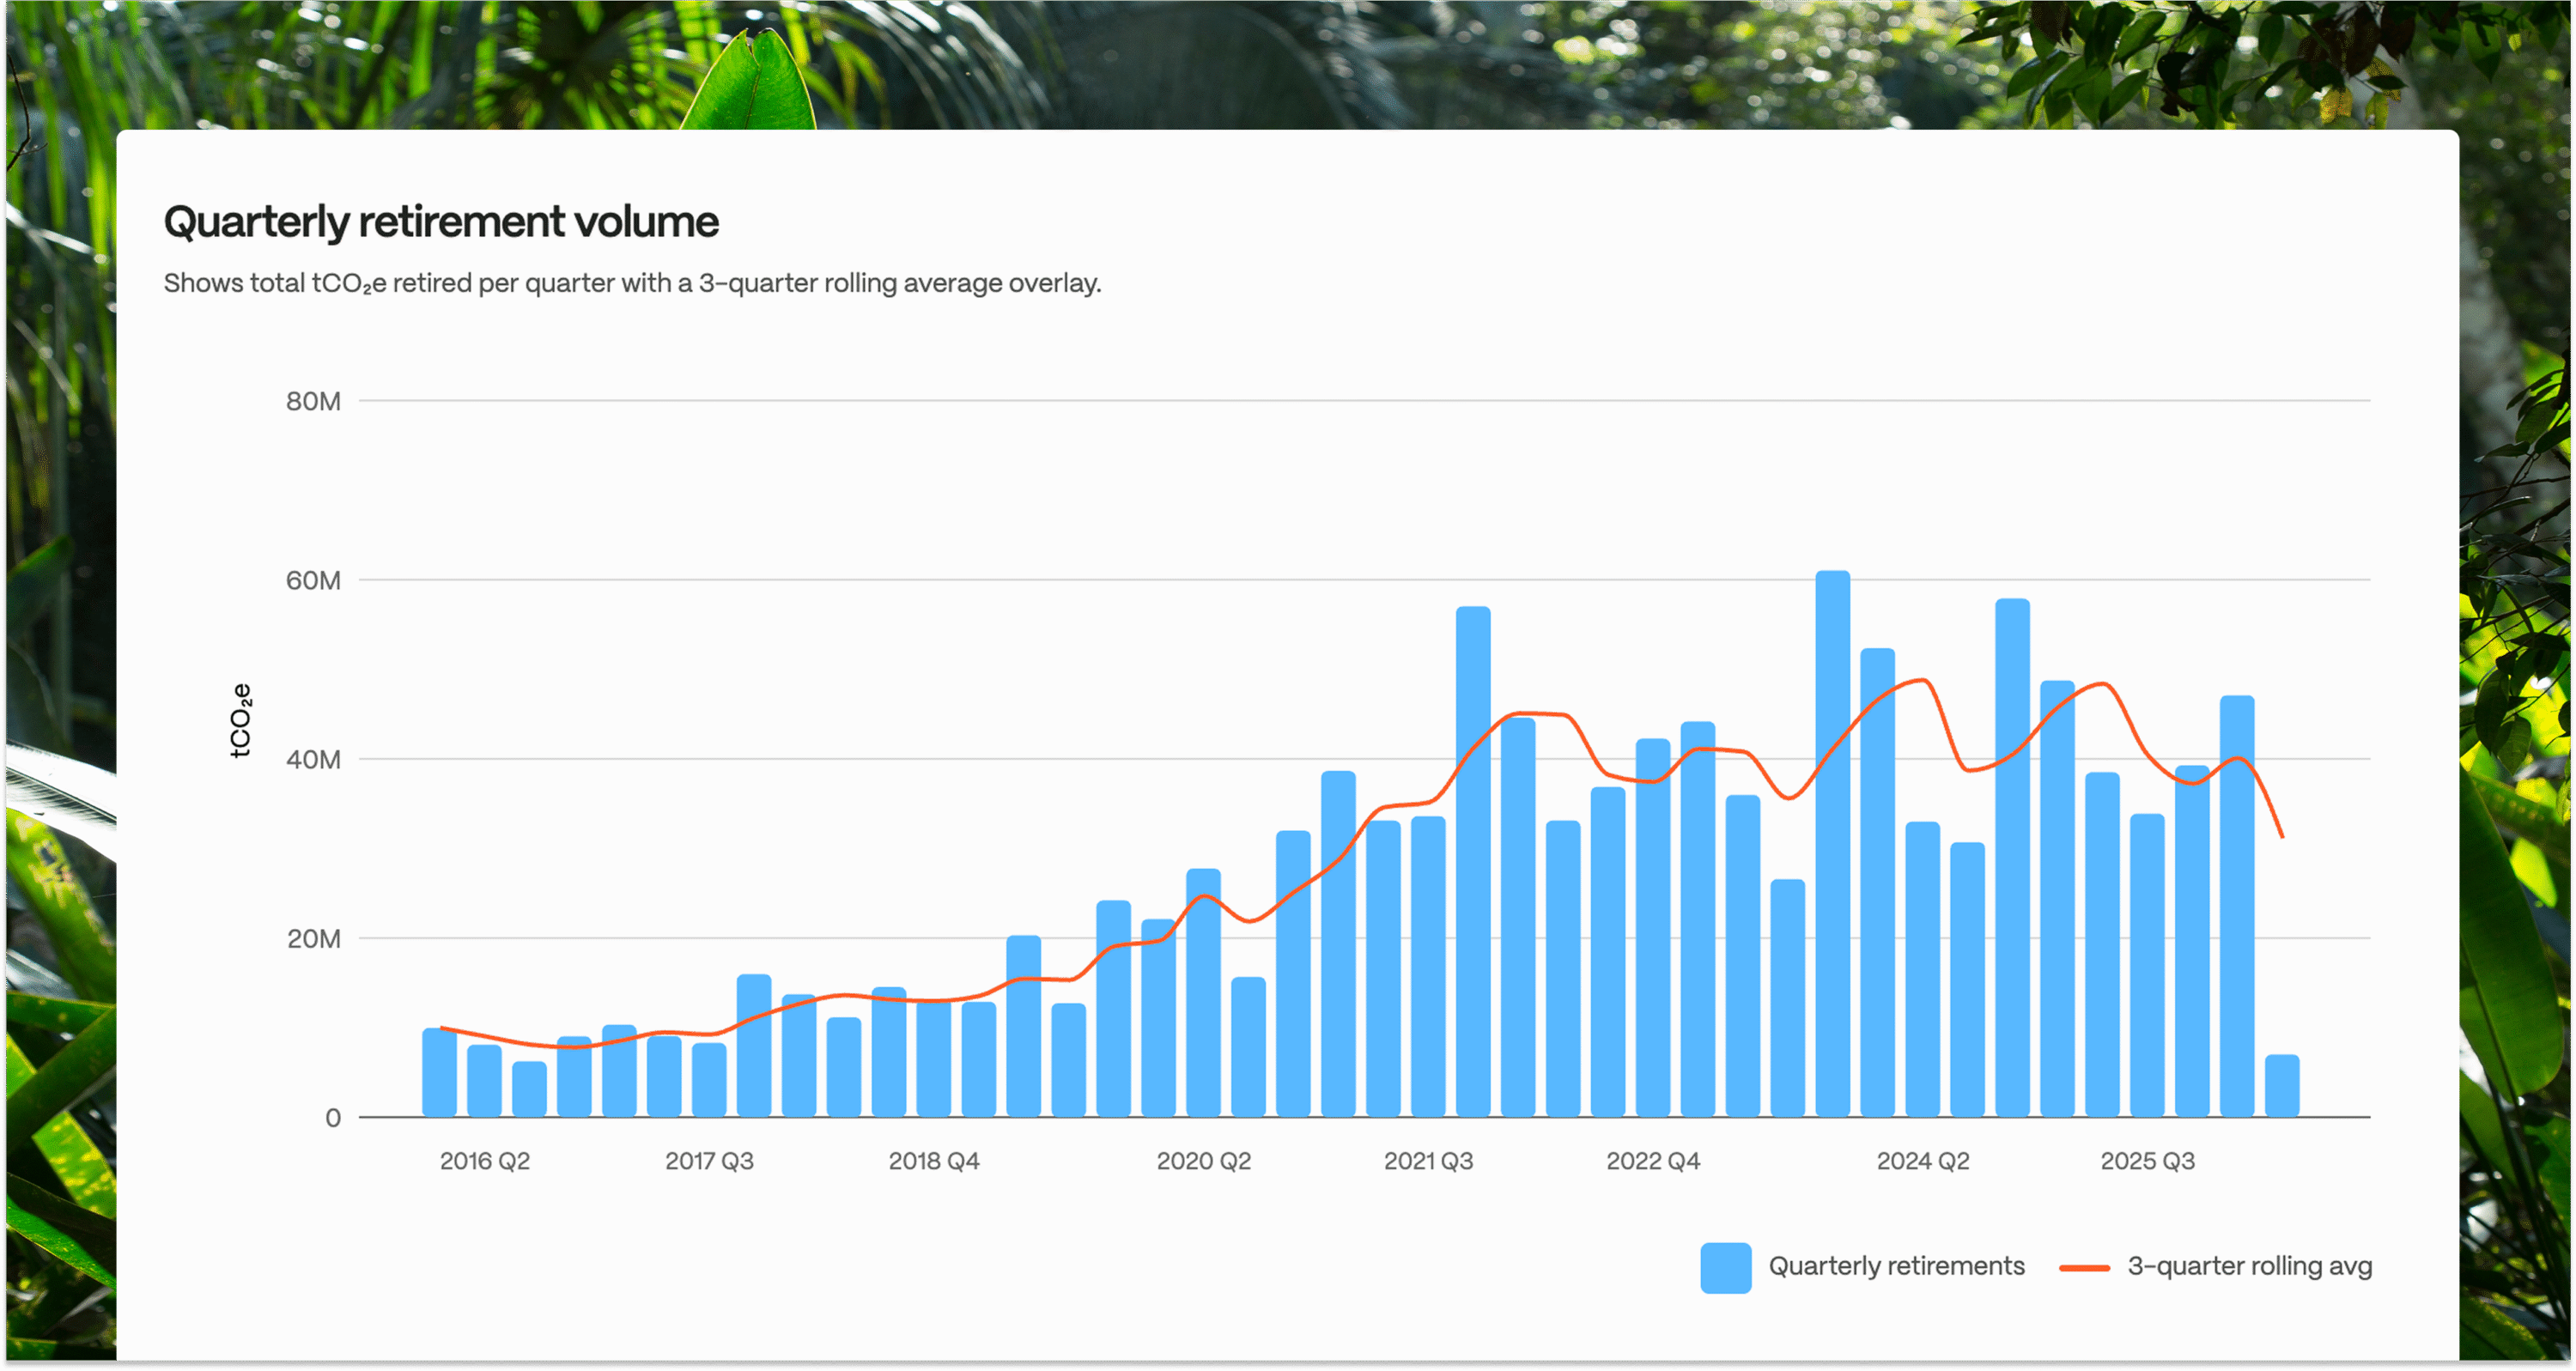
Figure 2: Actual quarterly retirements (bars) and 3-quarter rolling average (line). Source: Abatable
To better understand within-year retirement dynamics, we used a three-quarter rolling average to reduce quarter-to-quarter noise while quickly capturing market turning points. The metric acts as a demand pulse (Figure 2).
The most recent three-quarter retirement average (Q3 2025 to Q1 2026) sits at around 37mn tonnes, roughly 24% down compared to the average of the prior three quarters (Q4 2024 to Q2 2025). The dip looks more dramatic quarter-to-quarter than it does annually, with a pronounced decrease in Q1 2026 compared to Q1 2025. With annual volumes remaining similar, the quarter-by-quarter comparison provides a view of retirement seasonality.
Over the last five years, the market showed retirement spikes in Q4, which often reflected corporate reporting deadlines rather than structural demand growth. Similarly, there are temporary dips after large spikes, indicating market seasonality, but the trend between spikes and dips is of interest.
The three-quarter average helps with identifying the pattern. If the trend line on retirements rises over several quarters, demand is broadening, as shown over the 21 quarters between Q1 2016 and Q1 2022; if it falls sharply over several quarters, buyers are stepping back. Multi-quarter declines usually signal a weaker market sentiment.
Part of what drives the quarterly noise is the nature of the market itself. Most buyers transact carbon credits once a year, often tied to corporate reporting cycles, which explains consistent Q4 spikes over the last few years. As reporting guidance evolves, the timing of purchase and retirement of units may change.
The three-quarter average pattern observed since Q2 2022 to present is one of modulated increases and dips, an oscillation between highs reaching close to 50mn tonnes and lows of 37mn tonnes. The market has remained at a similar size, but the seasonality of retirements is reaccommodating over different quarters.
Takeaway three: Buyers are transitioning to more recent vintages as they become available
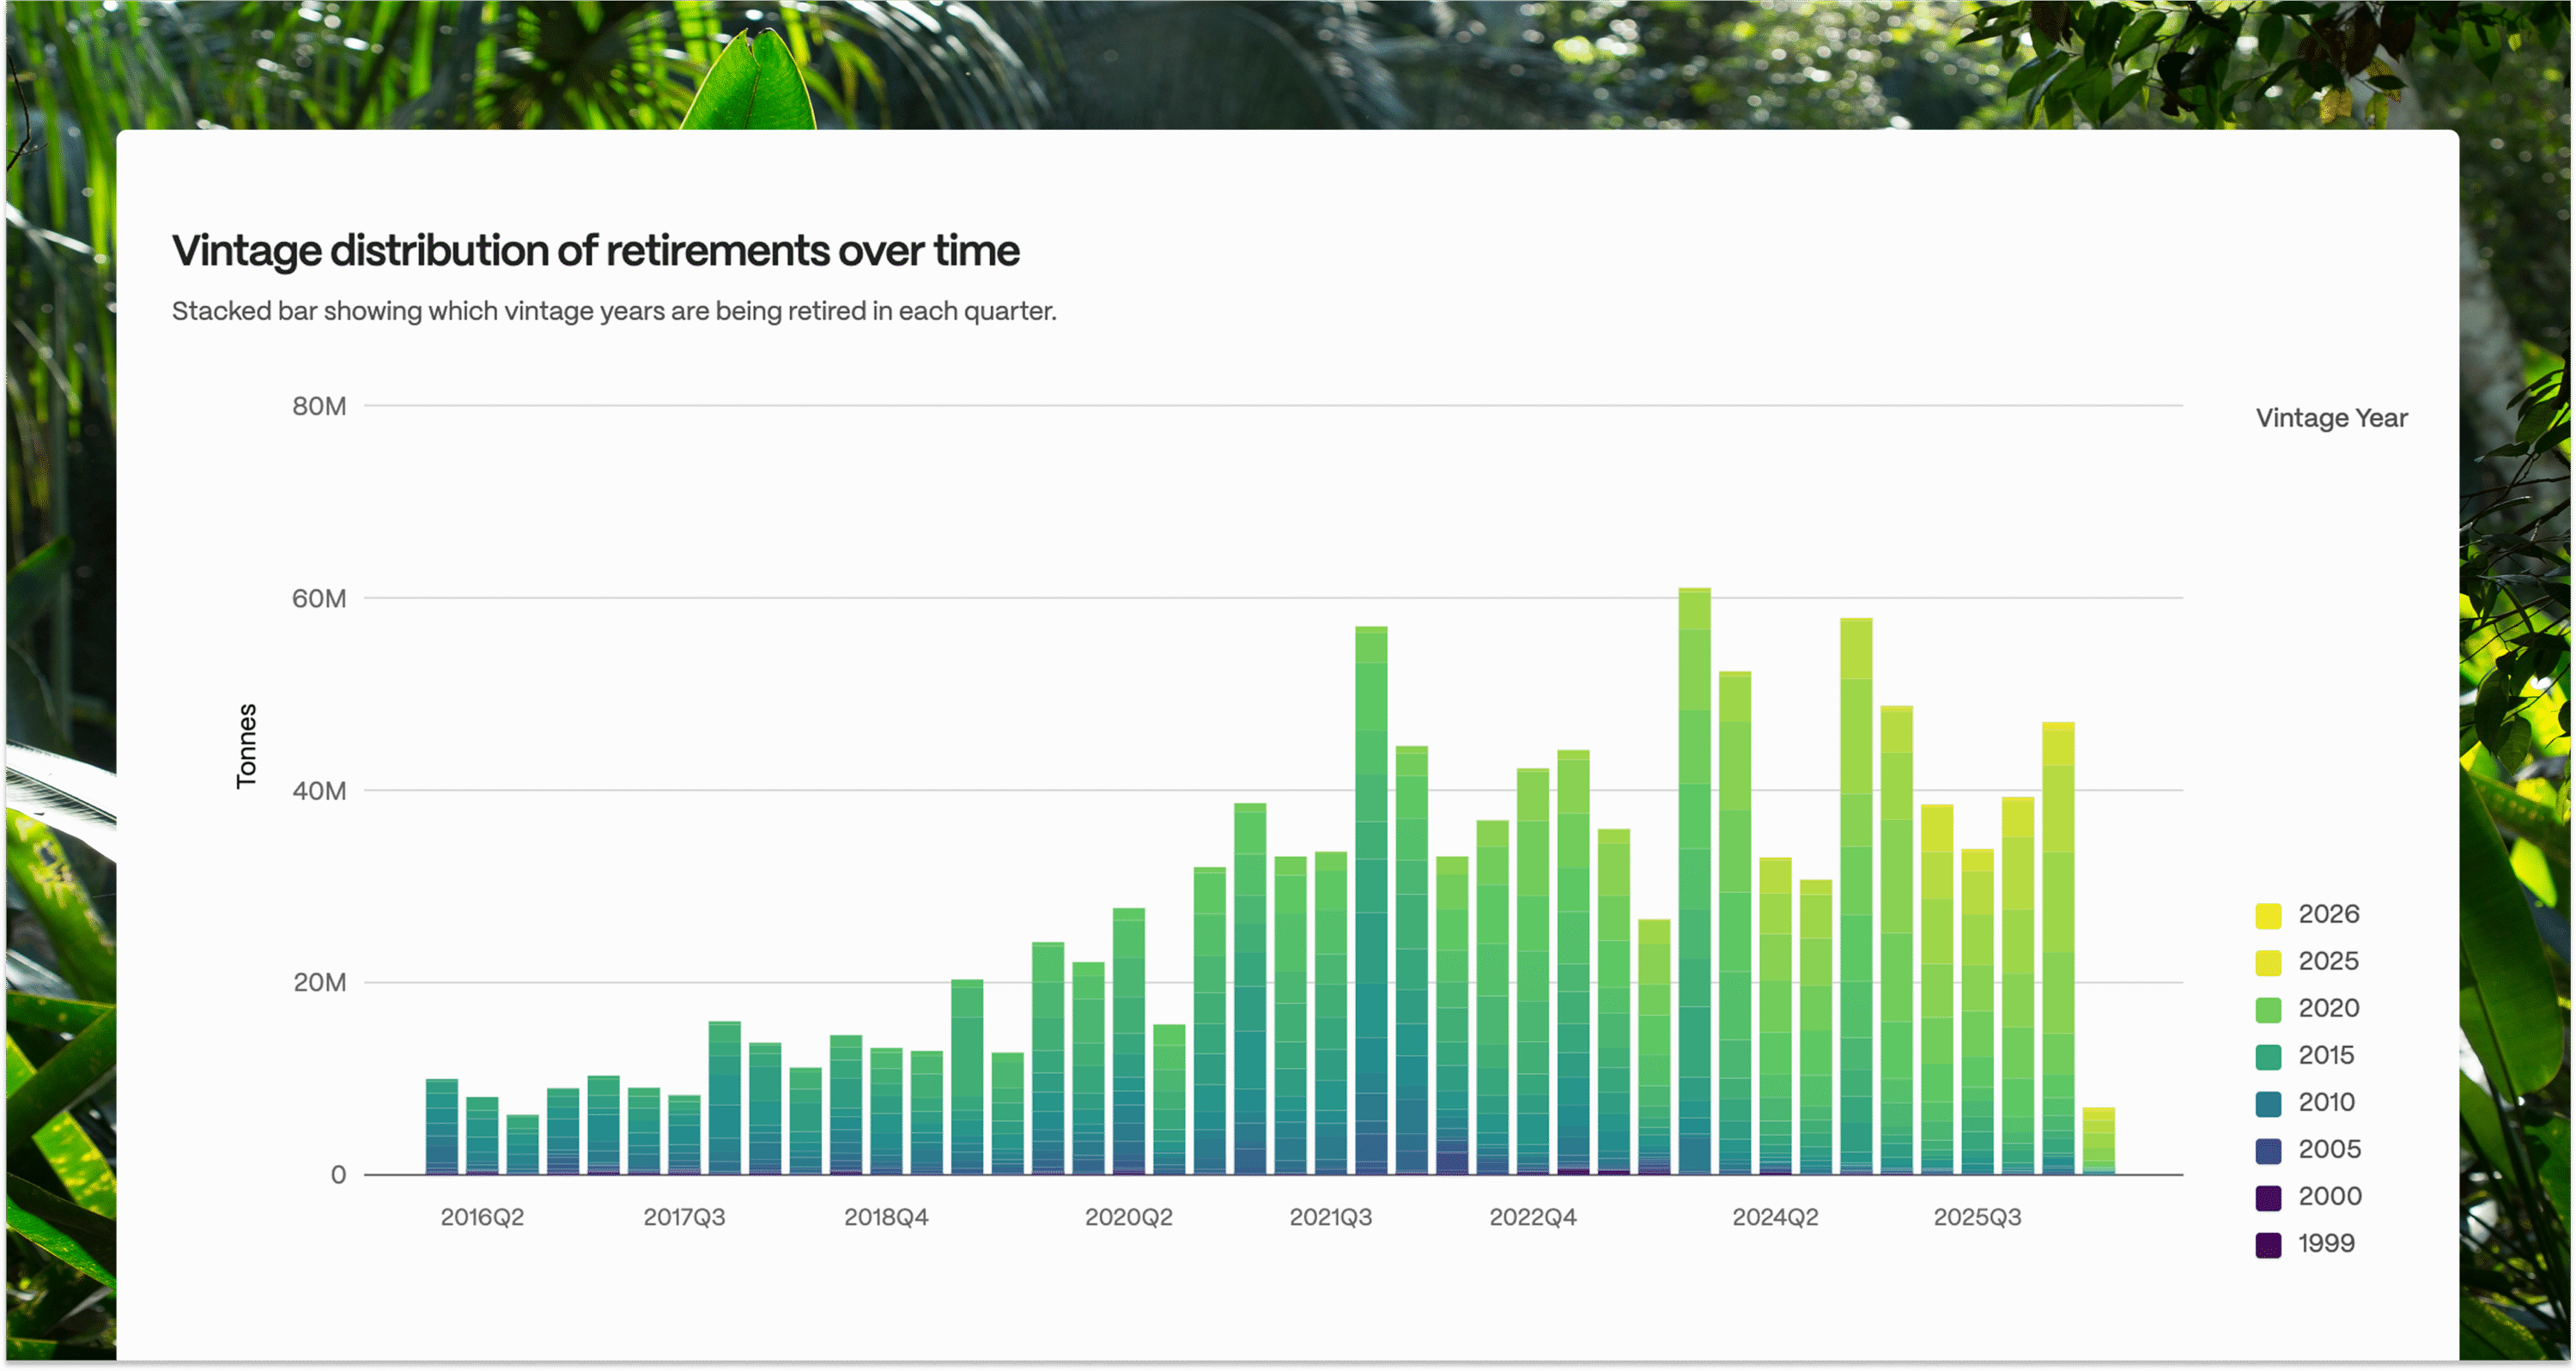
Figure 3: Vintage distribution of retirements by quarter. Source: Abatable
An important marker of market dynamics is the vintage of units retired. Typically, more recent vintages (e.g. 2025) signal units issued to projects that adhere to more recent, and potentially more stringent, requirements than those from a decade or more ago (e.g. 2010 vintage).
Examples of more stringent requirements include standard- or methodology-level measures and procedures to avoid double counting, compulsory reporting on contributions to sustainable development, compulsory social and environmental safeguards, the use of dynamic baselines, or the conservativeness of quantification factors.
Figure 3 presents quarterly retirements by vintage year. Each bar in this chart is stacked by vintage year, colour-coded from purple and dark blue (older vintages) through to shades of green and yellow (more recent vintages). The pattern that emerges over time is a gradual shift in colour toward the warmer end of the spectrum, indicating a transition in the vintages retired, from older to newer vintages, despite the market holding a surplus of older vintages.
As newer vintages enter the market through fresh issuances, buyers choose to retire them, while older stock is increasingly left on the shelf. For instance, retirements in Q1 2026 show a larger proportion of post-2021 vintages than in Q1 2023, which showed a greater variety of vintages, including some volumes from pre-2005 vintages.
Takeaway four: A credit is on average six years old when it is retired
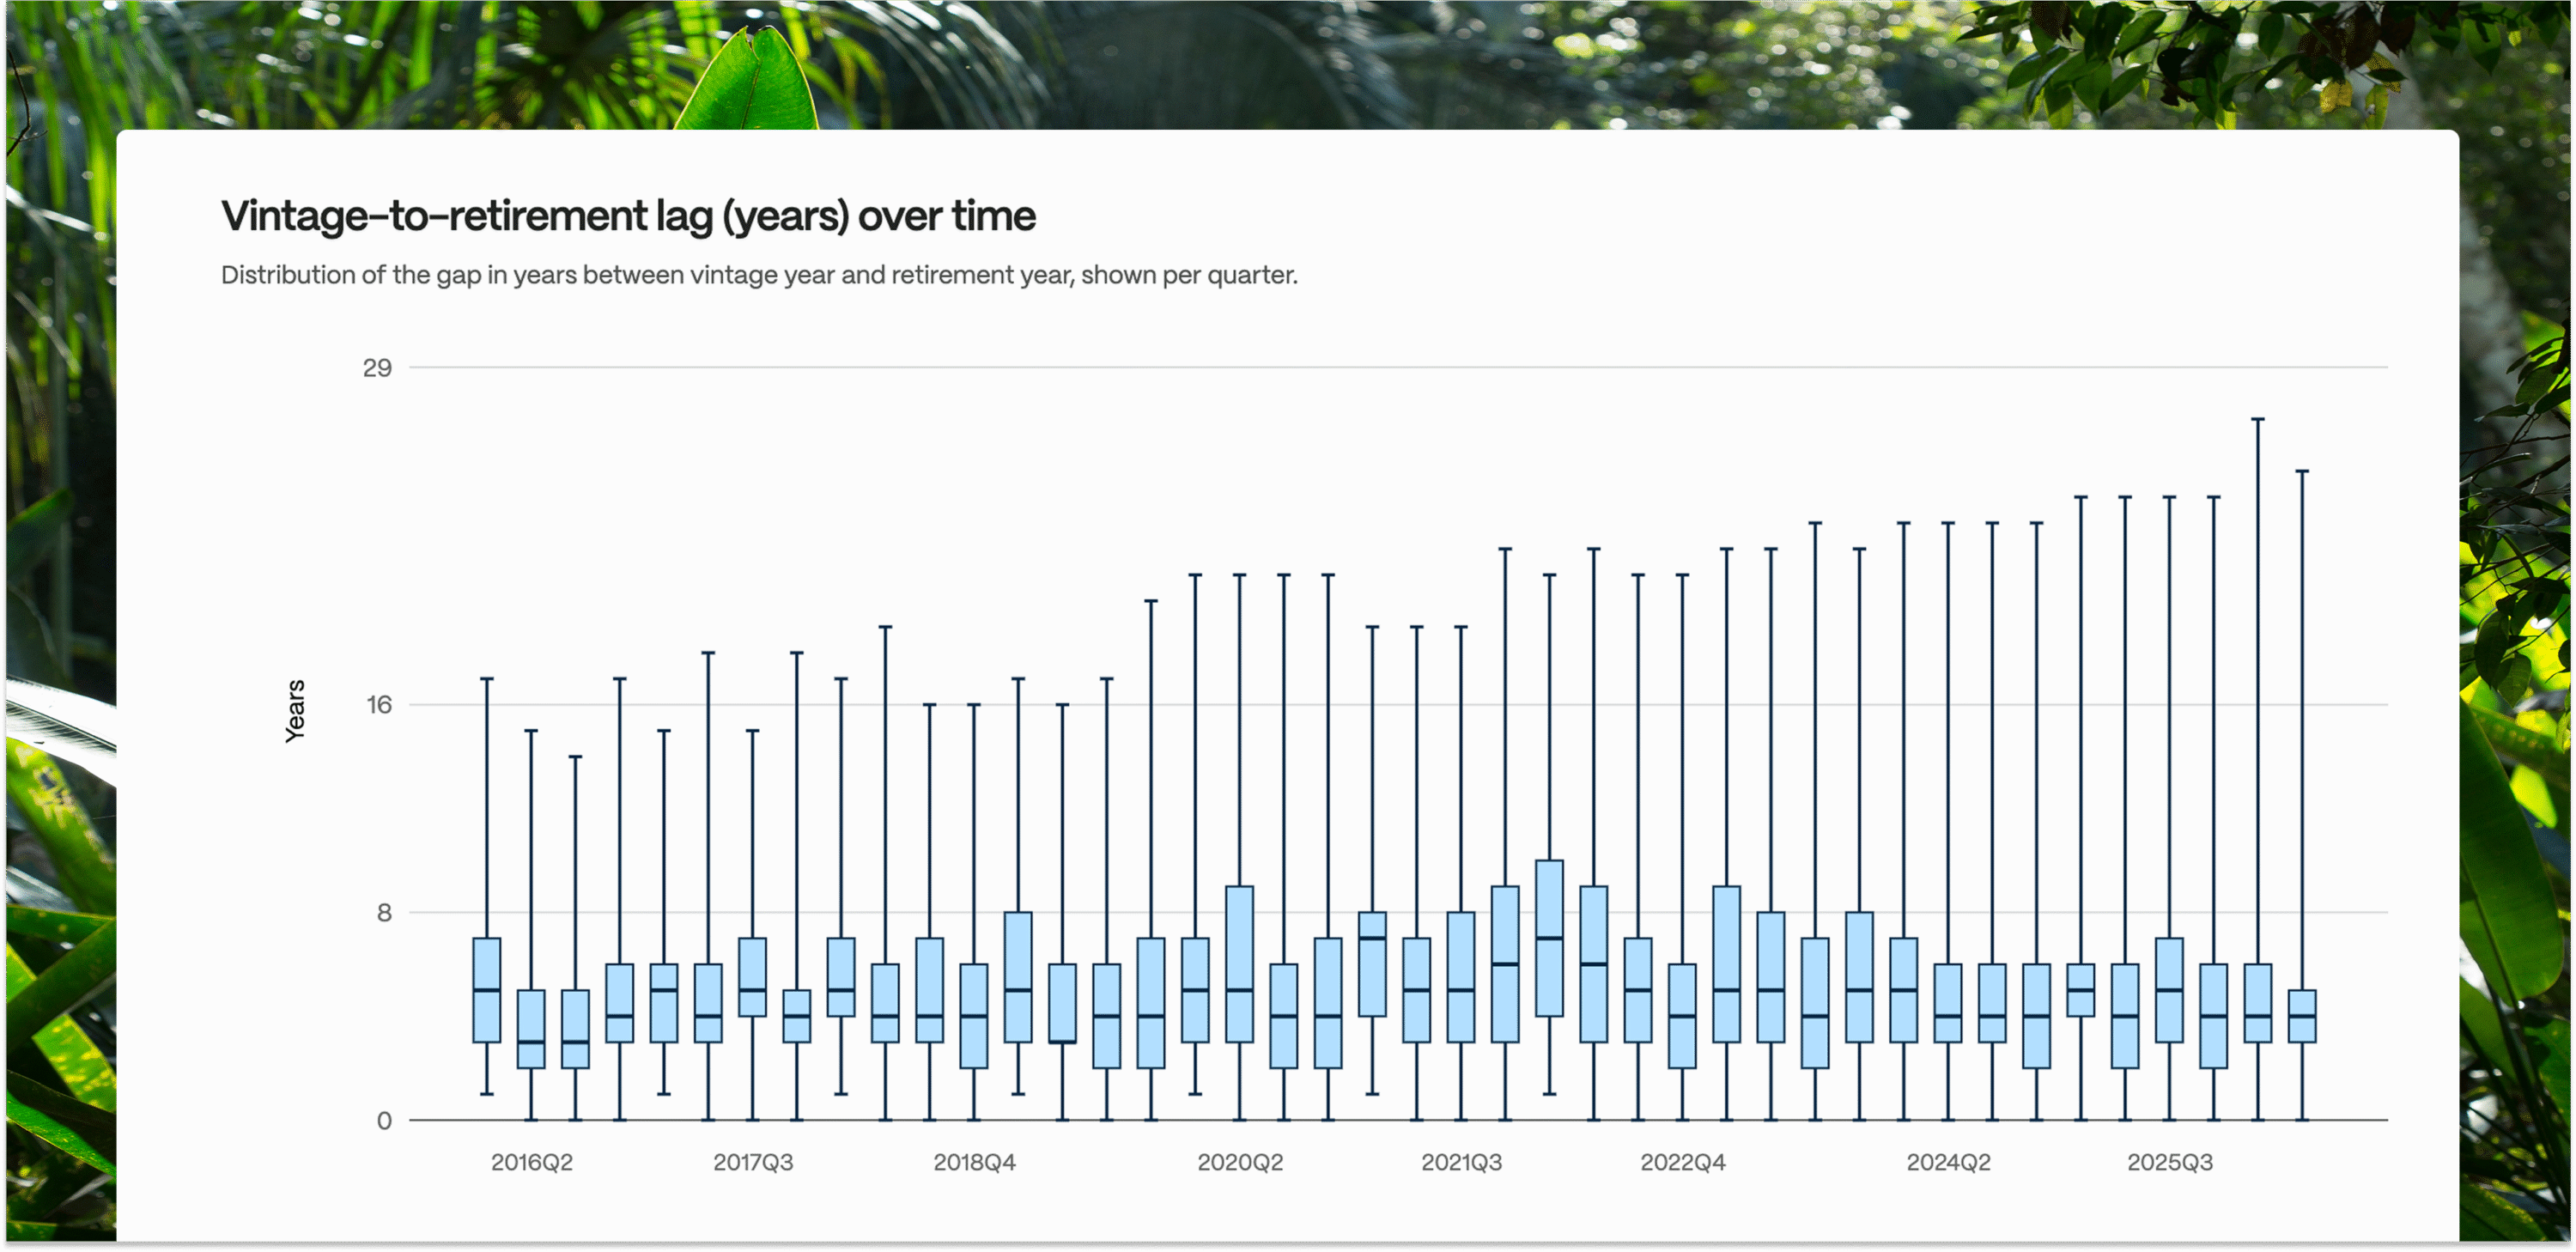
Figure 4: Distribution of vintage-to-retirement lag (years) by quarter. The middle line is the median, the box edges are the 25th/75th percentiles, and the whiskers show the full range.
The time between the vintage year of a credit and the year when it is finally retired presents another market dynamic. This vintage-to-retirement lag acts as a buyer thermometer: a short lag signals a hot market where buyers are actively seeking fresh, high-quality credits. A long lag – or a widening distribution – suggests cooling demand, with buyers equally drawing on older, cheaper supply sitting further back in the pipeline.
As more vintages become available in the market, the lag metric indicates whether buyers generally prefer newer vintages over older ones. For instance, in Q1 2026, a buyer could purchase and retire available credits with a vintage between 2000 and 2025. If buyers preferred older vintages over more recent ones (e.g. vintage 2000 over vintage 2021), the lag could be 25 years rather than five.
A shrinking lag (credits retired closer to their vintage year) over time suggests that buyers prefer newer credits and may be pricing in better quality, higher integrity, or other attributes that may be missing in older vintages. A widening lag can mean buyers are exploring a wider range of vintages, are more sensitive to credit prices, or that newer supply is constrained.
From a market dynamics perspective, if most projects in the market are new, the universe of issued vintages would be limited, and buyers would take what the market offered. A clear preference for recent vintages emerged, particularly post-2020, as corporate net-zero commitments intensified scrutiny on credit quality. However, older vintages never fully disappeared; a persistent baseline of legacy credits continues to be retired each quarter, suggesting a two-speed market where quality-conscious buyers chase fresh supply while cost-conscious buyers quietly draw down the backlog.
The current average lag sits at around six years (median five years), broadly stable relative to prior quarters.
In previous periods, however, the median lag was higher. For instance, between Q1 2019 and Q1 2022, lags were closer to the seven to eight-year mark. Yet in the most recent quarters, the dispersion is wider, indicating that some buyers in the market are also going for older vintages – i.e. credits with lower prices.
The combination of this chart and the vintage distribution data suggests that buyers are, on balance, gravitating toward more recently issued stock when they have a choice.
Takeaway five: The market is currently oversupplied, but the surplus growth is declining
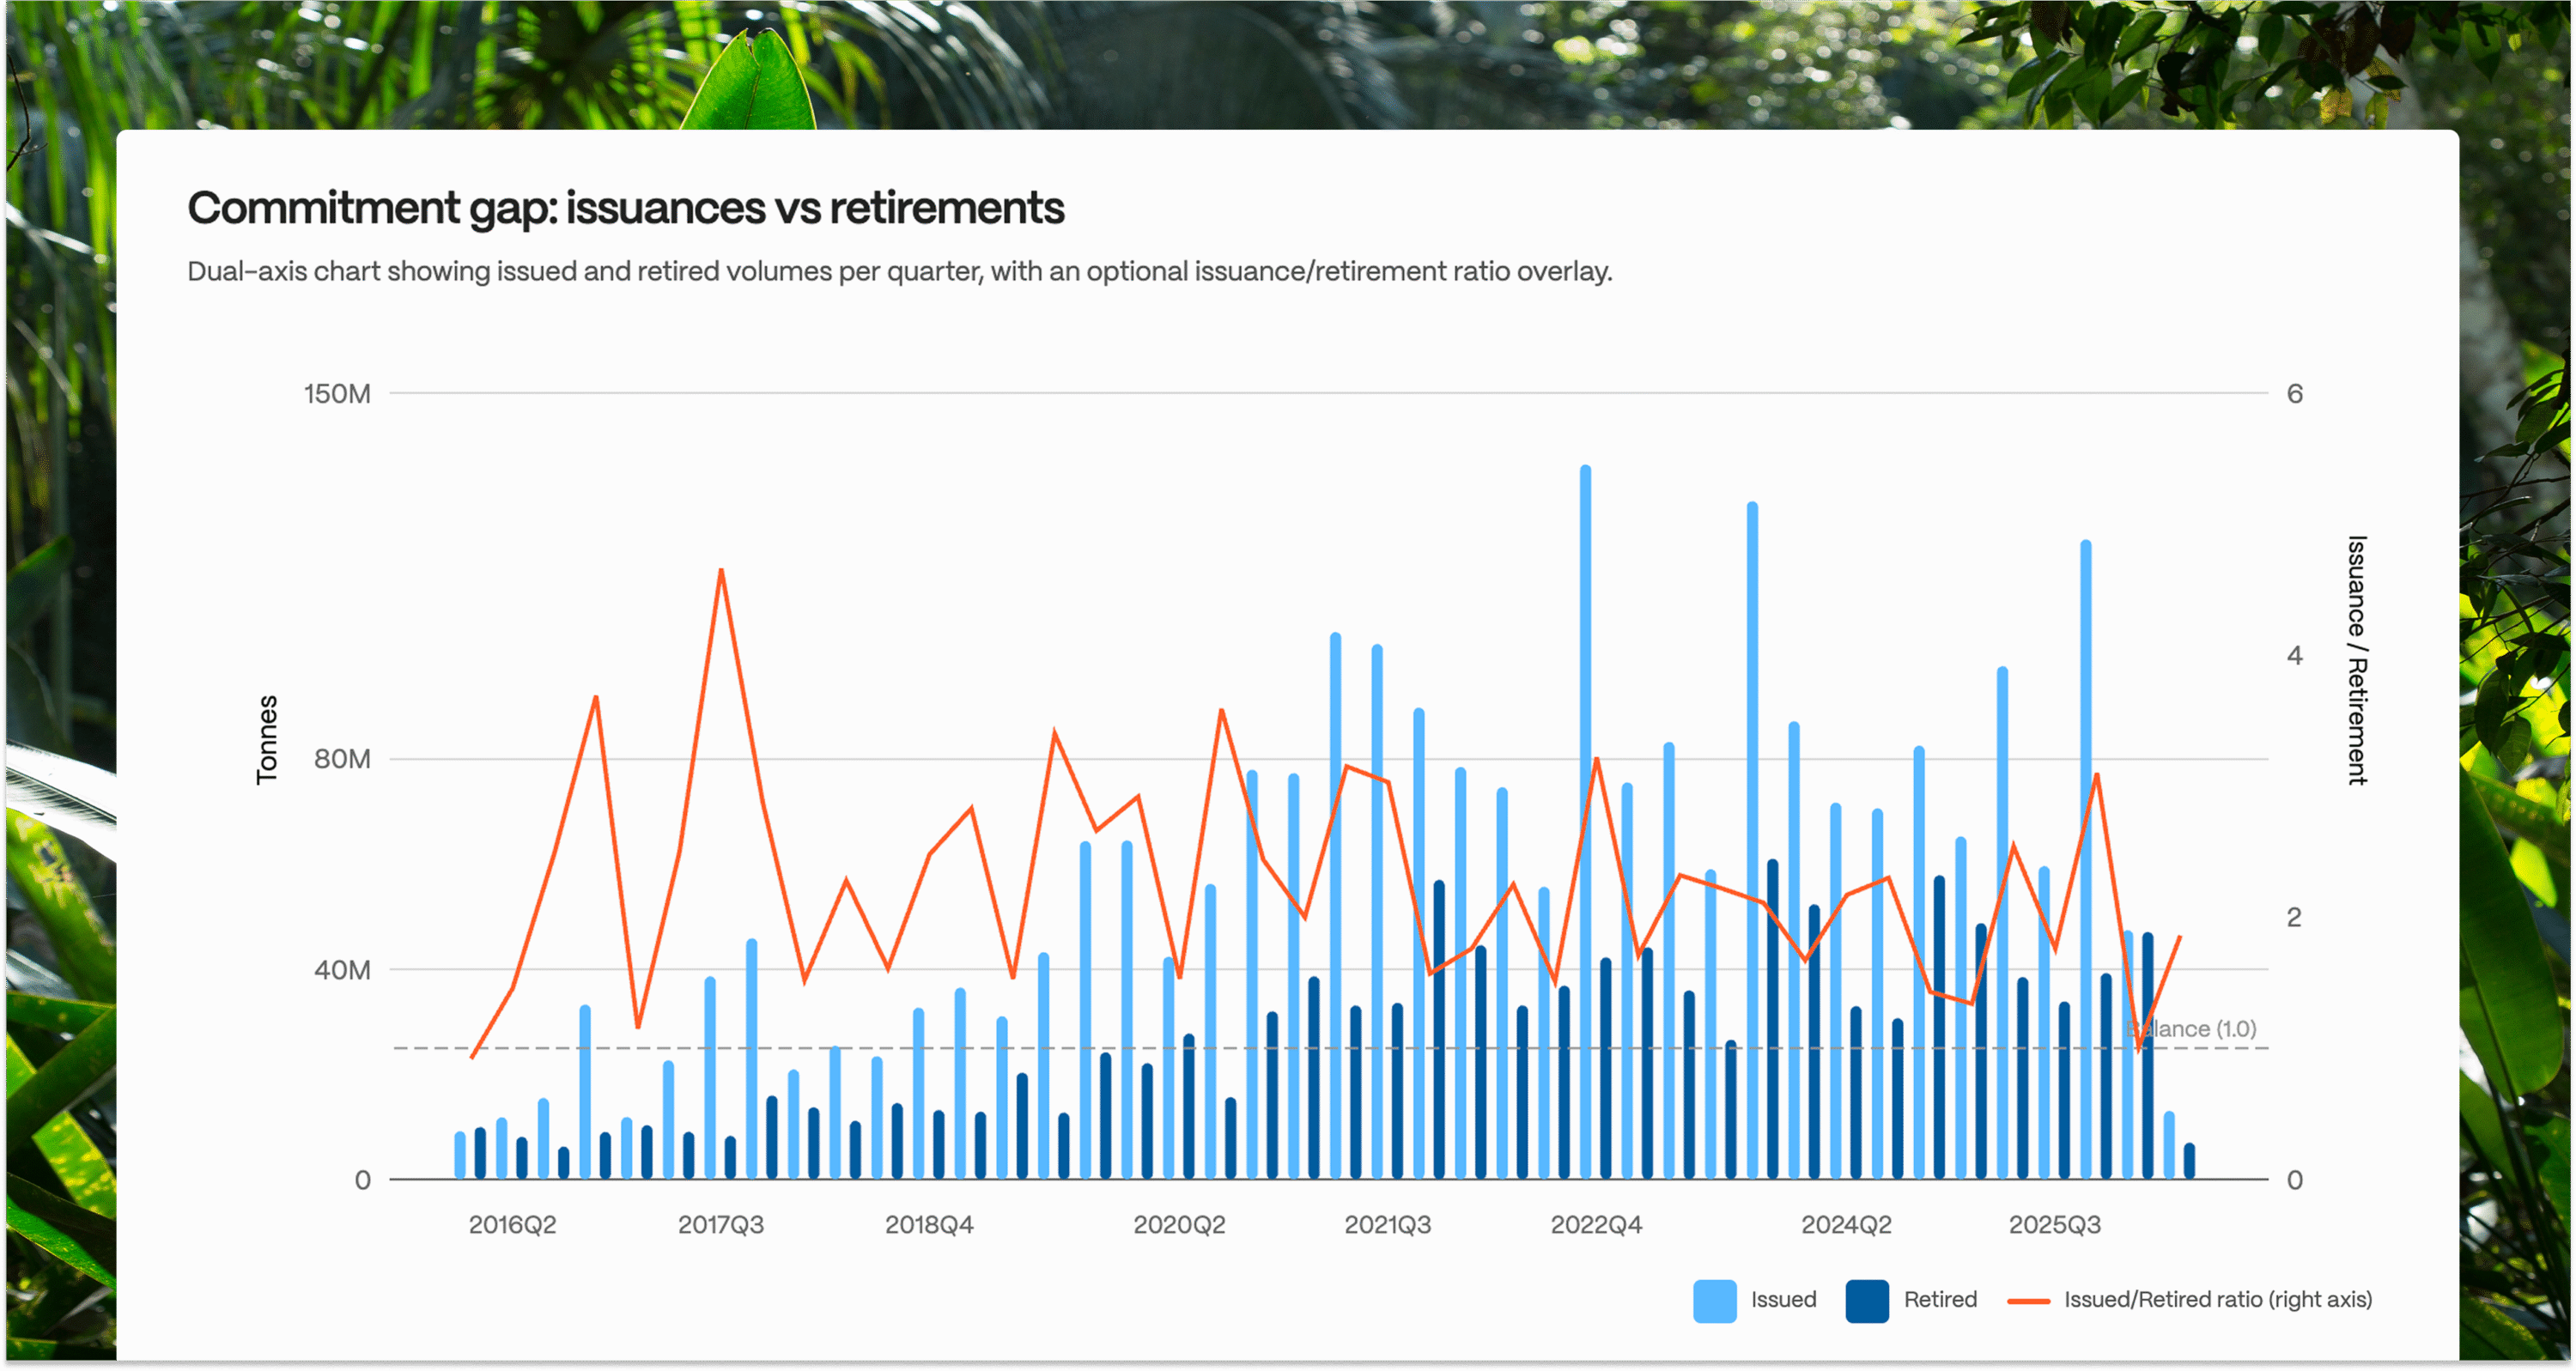
Figure 5: Issuances versus retirements by quarter.
Perhaps the clearest market signal comes from the balance between new issuances and retirements, and the ratio between them. Figure 5 plots quarterly issuance and retirement volumes side by side, with the issuance-to-retirement ratio overlaid. A ratio of one represents equilibrium; above one means more credits are entering the market than are being used, and below one means the market is retiring more credits than the volumes issued.
Over the last five quarters, the issuance/retirement ratio has averaged 1.54, meaning roughly 1.5 tonnes were issued for every tonne retired. This signals an oversupplied market. The current overhang in part traces back to an issuance surge around 2021, when project developers responded to rising retirement volumes, optimism about CORSIA eligibility, and the prospect of inclusion in various carbon pricing mechanisms. Many accelerated verification and issuance, often for vintages going back several years.
That supply has not been absorbed by equivalent demand growth, leaving a substantial inventory overhang that continues to weigh on prices. Looking at this chart by vintage breakdown, whether the surplus is concentrated in older or newer credits, adds important context to where that pressure is most acute.
Takeaway six: The buyer concentration in the VCM is improving (slightly)
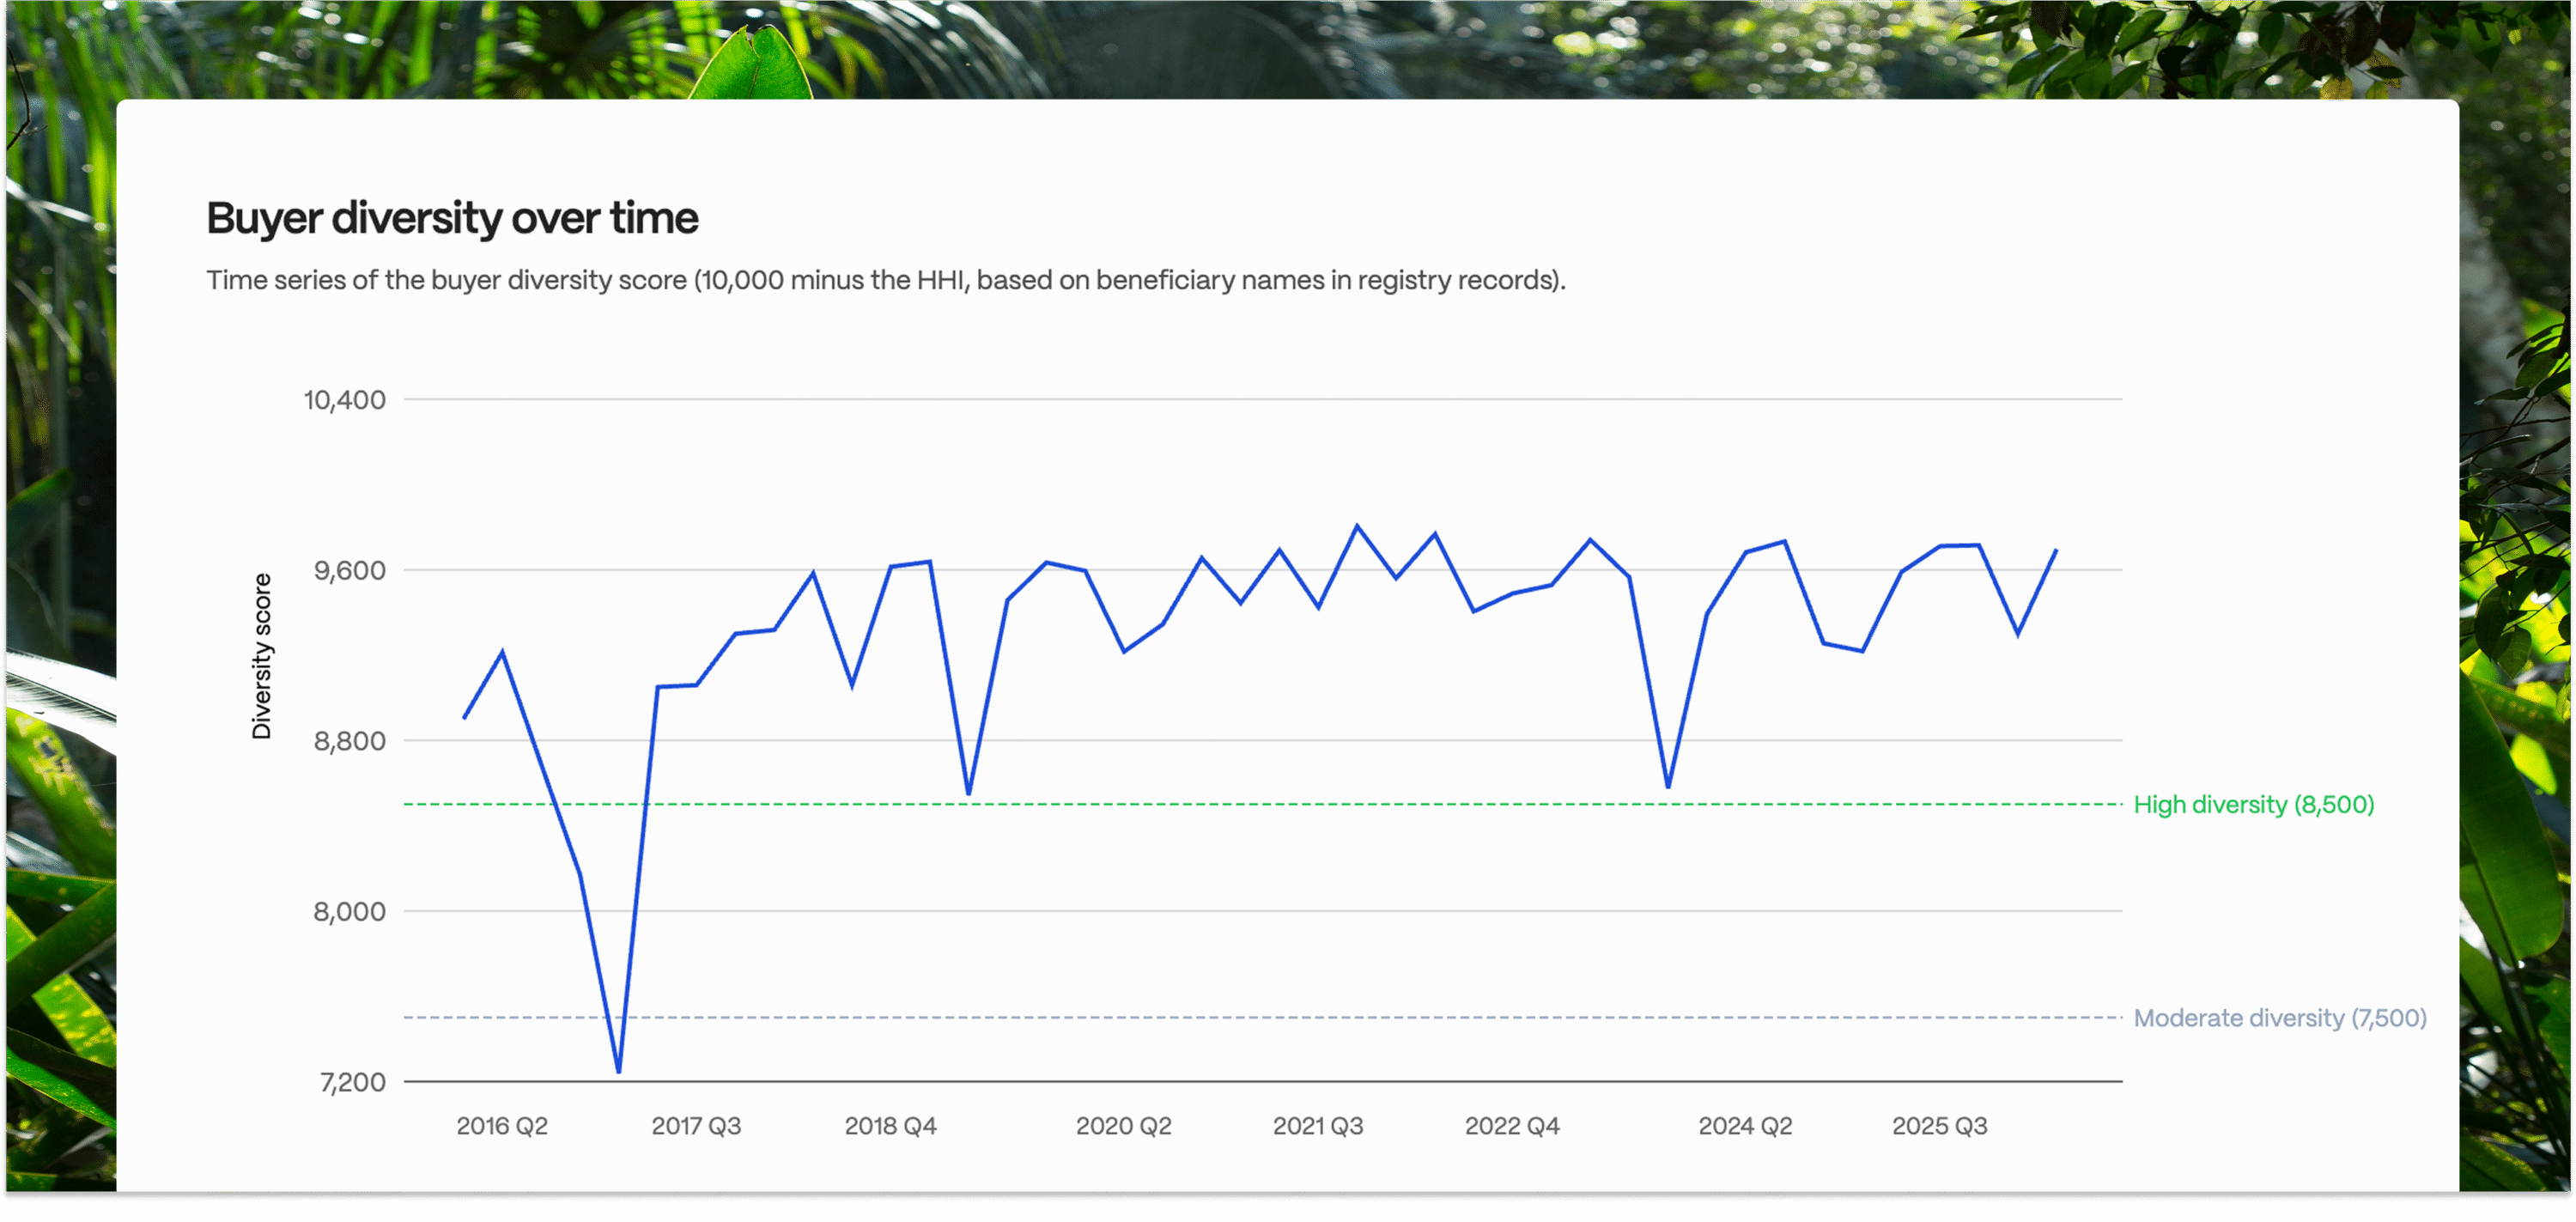
Figure 6: Buyer diversity via reversed Herfindahl-Hirschman Index (HHI)
Who is driving demand in the VCM? A market dominated by a few big players is more fragile than one with many active buyers.
The concentration of buyers in a market can be shown through a ’buyer diversity score’ by quarter, with higher values indicating a more diversified and resilient buyer base. This score is calculated as the inverse of the Herfindahl-Hirschman Index (HHI), a standard metric for measuring market concentration.
Rising values indicate retirements are spread across more buyers, which suggests healthier market depth, whereas falling values indicate dependence on fewer buyers, which makes demand more fragile if a major buyer exits.
As a guide, values above ~8,500 indicate relatively high diversity and values below ~7,500 indicate weaker diversity. Short-term spikes or dips may reflect one-off large retirements, so multi-quarter trend direction is more informative than any single point.
Over the last five quarters, the VCM diversity score has risen, reflecting a gradual broadening of the buyer base. This is consistent with a broader structural shift observed in our 2025 market overview report, Decoding the Voluntary Carbon Market in 2024 and beyond: some of the large legacy buyers that historically dominated retirements have scaled back, while a wider set of smaller buyers has entered the market.
Looking beyond headline supply and demand balances per year, these takeaways illustrate a highly seasonal market with a diversifying set of buyers that favour newer vintages. To keep up to speed with how these trends change in the future, our new regularly update Market Dynamics Abatable platform feature allows an enhanced level of understanding of the market. We hope you find it useful.
To interact with the data discussed in this article and for more information, visit the new quarterly update Market Dynamics section in the Abatable Platform, where Pro users can also filter by project type, methodology and geography.