Abatable’s regularly updated carbon pricing data highlights the different factors influencing carbon prices in 2024. Juan Carlos Arredondo Brun writes.
Abatable believes in the importance of democratising carbon market data to facilitate and enhance market operation and growth. As such, Abatable’s fundamental carbon credit pricing information is now available for free within our intelligence platform.
Our pricing information is sourced from proprietary price points, based on real trades and quotes directly from carbon project developers and intermediaries conducting market transactions through Abatable’s unique carbon sourcing platform, enriched with additional carbon credit price information from multiple sources. This combination of sources creates a detailed and reliable overview of credit prices for activity types within the voluntary carbon market.
Pro users of our platform can filter our historical pricing data by the registry, credit vintage, project location, methodology used, certifications, price type and volume associated with the purchase or quote.
Regularly updated data
We currently add new up-to-date price points into our platform on a monthly basis, reflecting the type, number and volumes of trades we see in the market. We are planning to increase the frequency of new pricing data additions to our platform in 2025.
Our November 2024 data ingest totalled 1,091 price points, 50% of which were quotes and 50% were direct trades across all of the ten project types we cover – REDD+ / Avoided deforestation, afforestation and reforestation (ARR), improved forest management (IFM), sustainable agriculture, wetland restoration, renewable energy, industrial efficiency and waste management, cookstoves and energy efficiency, biochar and carbon capture and engineered solutions.
Price variation
There are a multitude of factors affecting specific carbon credit prices, including credit vintage, the size and location of a given project, the methodology used to create the credits, the version of this methodology, what co-benefits the project can offer and also whether it has any additional certifications.
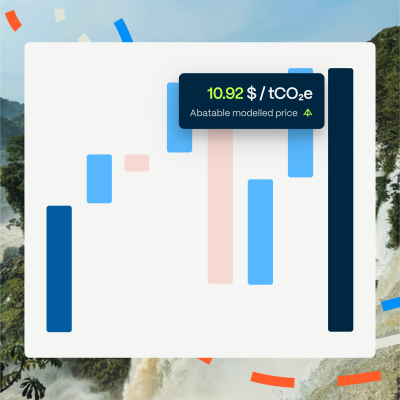
Our pricing data indicates that prices for afforestation and reforestation (ARR) project types oscillated in the first quarter of 2024, becoming more stable but widely spread towards the second half of the year (see Figure 1).

Figure 1. Minimum, first to third quartile and maximum prices for afforestation and reforestation project credits in Abatable’s intelligence platform. Minimum and maximum prices are represented by the lower and upper line points for each month, with the first to third quartile price range represented by the thicker bars for each month.
Prices for REDD+ projects remained relatively stable during the year, albeit with a slight downward trend. Some REDD+ projects continue to be traded at a significant premium, despite the continuous scrutiny of specific projects or methodologies in the market (see Figure 2). Despite this scrutiny, the carbon credit volumes retired in 2024 still signal a preference for REDD+ activities relative to other carbon project types.

Figure 2. Minimum, first to third quartile and maximum prices for REDD+ project credits in Abatable’s intelligence platform. Minimum and maximum prices are represented by the lower and upper line points for each month, with the first to third quartile price range represented by the thicker bars for each month.
Wetlands restoration has emerged as a recently preferred climate mitigation option given its positive impacts on a locality beyond carbon sequestration. On average, prices for this project type remained above the mean values of REDD+ and quite similar to those of ARR – a potential indication of market preferences towards nature-based carbon removals rather than emissions avoidance (see Figure 3).

Figure 3. Minimum, first to third quartile and maximum prices for wetlands restoration project credits in Abatable’s intelligence platform. Minimum and maximum prices are represented by the lower and upper line points for each month, with the first to third quartile price range represented by the thicker bars for each month.
As shown in Figures 1 to 3, first to third quartile and minimum prices are relatively uniform, apart from wetland restoration prices, which show more volatility. This is to do with the relatively fewer trades and quotes seen for wetland restoration projects relative to other project types, as they make up a smaller proportion of the market compared to ARR and REDD+ projects. The relatively smaller number of projects and geographical coverage relative to other nature-based solutions options, as well as the fact this is a relatively more nascent project type in the voluntary carbon market, means wetland restoration projects as a group are more sensitive to market fluctuations.
What drives prices?
As can be seen in Figures 1 to 3, there are significant variations in the minimum and maximum prices seen across all three project types across the year. First, second and third quartiles of the prices are also difficult to predict as no single event has had a uniform impact across prices for all project types. We can clearly observe that events like the announcement of eligibility (e.g. for the CORSIA scheme for offsetting aviation emissions), or environmental integrity labelling (e.g. the IC-VCM’s Core Carbon Principle labels at a project type level) did not have a fundamental impact on prices in 2024.
The acceptance of carbon credits across some compliance markets (e.g. for the compensation of carbon taxes in Singapore, Colombia and South Africa) brings a fiscally defined price per tonne of CO2. Yet, the volumes used in compensation and the diverse nature of the fiscal fees charged make it difficult to translate those examples into global prices for different project types, such as the ones explored here.
The VCM has struggled with price transparency for some time, with participants calling for standardised products and exchange-based transactions for better price discovery. With more price transparency, which we’re hoping to provide through our intelligence platform, ultimately market participants will have more information and it’s likely that the factors explored in this article will have a more pronounced effect on prices across different carbon project types.
At Abatable we constantly monitor carbon market price trends, reporting pricing data and insights in our free-to access intelligence platform. Find out more and sign up for a free account here.


